
Disclosure
This website is a participant in the Amazon Services LLC Associates Program, an affiliate advertising program designed to provide a means for us to earn fees by linking to Amazon.com and affiliated sites.
A lithium cell at 50% charge typically shows 3.6V to 3.7V in its natural, rested state. This mid-point voltage reflects a stable state of charge and helps you monitor battery health with confidence.
This complete guide reveals exact voltage readings for Li-ion, LiFePO4, and LiPo cells at half charge. You’ll also get expert tips on reading voltage curves and avoiding common measurement mistakes that skew results.
Key Takeaways
- 3.6V–3.7V is the typical rested voltage for a standard Li-ion cell at 50% charge.
- LiFePO4 reads about 3.2V–3.3V at half charge due to its flatter curve.
- Measure only after resting 1–2 hours; load and charging skew readings.
- Voltage alone is a rough estimate—LiFePO4’s flat curve limits accuracy.
- Temperature and cell age shift 50% voltage by 0.05V–0.1V.
Best Battery Testers and Monitors for Checking 50% Charge Voltage
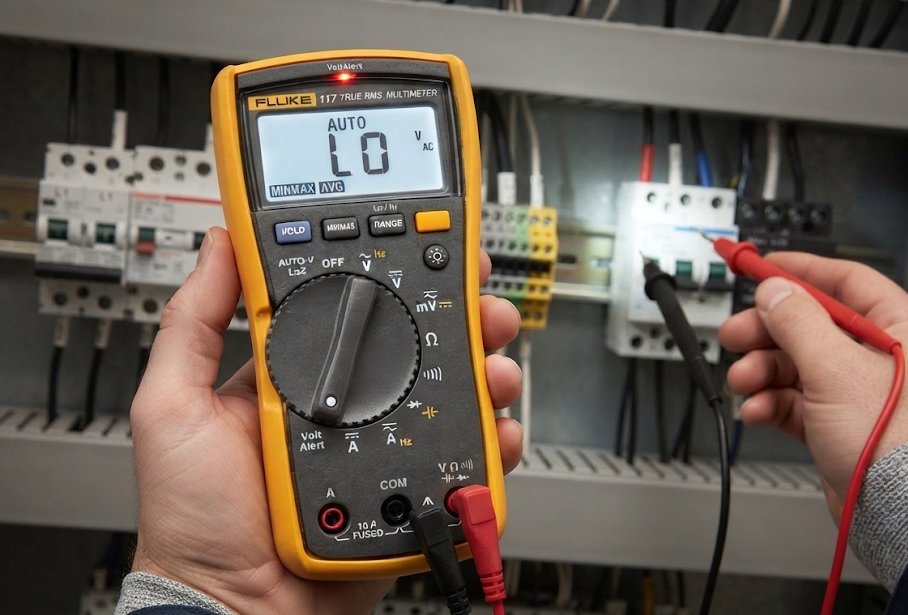
1. Fluke 117 Electrician’s Multimeter – Best Overall Choice
The Fluke 117 delivers lab-grade DC voltage accuracy of ±0.5%, making it the recommended tool for verifying lithium cell voltage at 50% charge. Its auto-ranging display and built-in non-contact voltage detection suit both hobbyists and professionals. Ideal for single-cell readings where precision matters most.
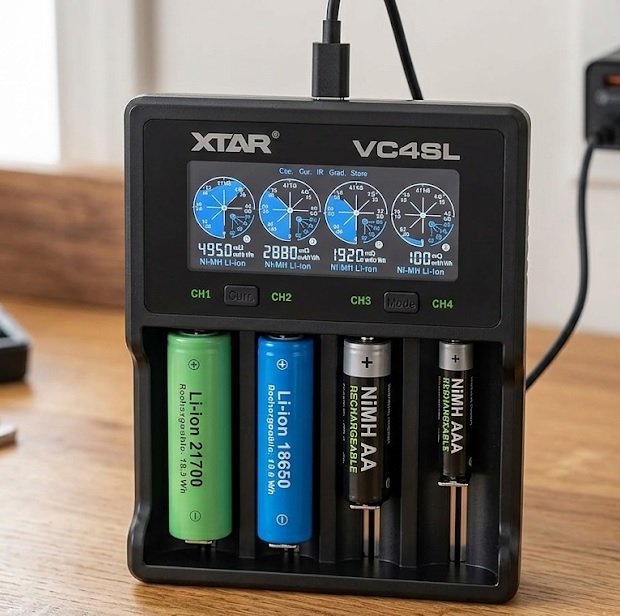
2. XTAR VC4SL Battery Charger – Best for Capacity Testing
The XTAR VC4SL combines charging with real-time voltage and capacity readouts, so you can confirm a cell truly sits at 50% state of charge. It supports Li-ion, LiFePO4, and NiMH chemistries. A best option for hobbyists analyzing multiple 18650 cells at once.
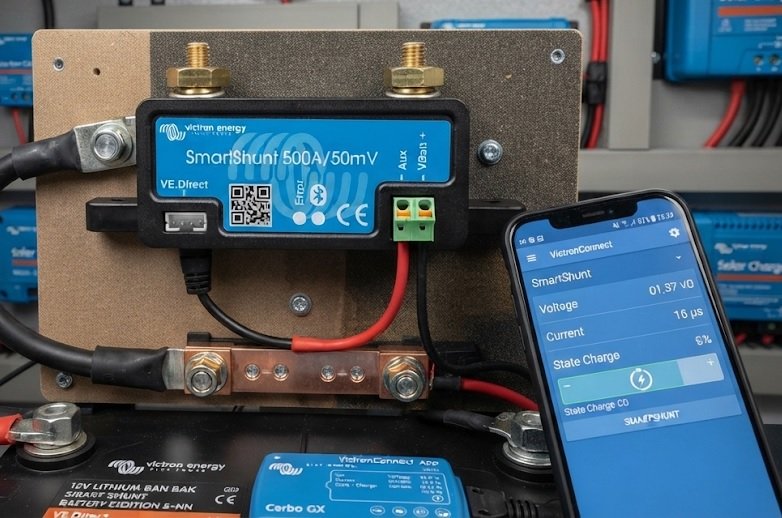
3. Victron SmartShunt 500A – Best for Battery Banks
The Victron SmartShunt 500A tracks state of charge via Bluetooth for full battery banks, not just single cells. It converts voltage readings into accurate 50% charge estimates using coulomb counting. Ideal for solar and RV setups needing reliable mid-point monitoring.
Typical Voltage of Lithium Cells at 50% Charge by Chemistry
Lithium cells at 50% state of charge don’t share one universal voltage. Each chemistry has its own discharge curve, so the mid-point voltage varies significantly. Understanding these differences prevents misreading your battery’s true charge level.
Li-ion (NMC) Cells at 50% Charge
A standard Li-ion NMC cell rests near 3.6V to 3.7V at half charge. This applies to common 18650 and 21700 cells used in laptops and power tools. The nominal 3.7V rating roughly equals the 50% mark.
LiFePO4 Cells at 50% Charge
LiFePO4 chemistry sits lower, typically 3.2V to 3.3V at 50% charge. Its flat discharge curve makes voltage-only estimates unreliable. Most LiFePO4 cells stay between 3.2V and 3.3V across 20–80% capacity.
LiPo Cells at 50% Charge
LiPo cells mirror Li-ion behavior, reading about 3.7V at half charge. RC hobbyists often target 3.8V per cell for storage. Slight variations appear between manufacturers and cell formats.
Quick Comparison Table
| Chemistry | Voltage at 50% | Nominal Voltage |
|---|---|---|
| Li-ion (NMC) | 3.6V–3.7V | 3.7V |
| LiFePO4 | 3.2V–3.3V | 3.2V |
| LiPo | 3.7V–3.8V | 3.7V |
Quick Recap
- Li-ion and LiPo: ~3.7V at 50%
- LiFePO4: ~3.2V–3.3V at 50%
- Always match voltage to chemistry before judging charge
How to Measure Lithium Cell Voltage at 50% Charge Accurately
Getting a reliable 50% charge reading requires more than touching a multimeter to the terminals. Rest state, temperature, and load all distort the number you see. Follow these proven methods for accurate results.
Step-by-Step Measurement Process
- Disconnect all loads and let the cell rest for 1–2 hours.
- Set your multimeter to DC voltage (20V range works for single cells).
- Touch the probes to positive and negative terminals firmly.
- Record the stable reading after the display settles.
Why Resting Voltage Matters
Voltage sags under load and spikes during charging. A cell reading 3.5V while powering a device may actually rest at 3.7V. This open-circuit voltage (OCV) is the only figure comparable to standard 50% charge tables.
Common Mistakes That Skew Readings
- Measuring during charge: Inflates voltage by 0.1V–0.3V.
- Testing cold cells: Low temperatures raise internal resistance and drop voltage.
- Using aged cells: Capacity fade shifts the 50% voltage point slightly.
- Ignoring chemistry: Applying Li-ion tables to LiFePO4 gives false results.
Measurement Essentials
- Rest cells 1–2 hours before testing
- Use open-circuit voltage, never loaded readings
- Match voltage tables to the correct chemistry
Why Voltage Alone Can’t Confirm 50% Charge
Voltage gives a useful snapshot, but it rarely tells the full story. A lithium cell’s discharge curve is non-linear, staying flat through the middle range. That flatness makes 50% charge notoriously hard to pinpoint from voltage alone.
The Flat Discharge Curve Problem
Most lithium cells drop quickly from 4.2V, then plateau near 3.7V for a large chunk of capacity. A cell at 40% and one at 60% may both read 3.65V. This overlap is why voltage-only fuel gauges drift over time.
Better Methods for Determining State of Charge
- Coulomb counting: Tracks current in and out for precise capacity tracking.
- Impedance tracking: Measures internal resistance changes as the cell ages.
- Model-based gauges: Combine voltage, current, and temperature data.
- Hybrid algorithms: Merge coulomb counting with periodic voltage correction.
When Voltage Is Good Enough
For quick field checks, voltage remains practical. A rested 3.7V Li-ion cell is close enough to 50% for storage or rough planning. Just don’t rely on it for critical capacity decisions.
| Method | Accuracy | Best Use |
|---|---|---|
| Voltage (OCV) | ±10–15% | Quick checks |
| Coulomb counting | ±1–3% | BMS, EVs |
| Impedance tracking | ±5% | Aging analysis |
Key Point
- Flat curves make voltage-only 50% estimates unreliable
- Coulomb counting delivers the highest accuracy
- Use voltage for quick checks, not critical decisions
Factors That Shift 50% Charge Voltage in Lithium Cells
Even with the same chemistry, two identical cells can show different voltages at 50% charge. Temperature, age, and cell design all nudge the mid-point reading. Recognizing these variables helps you interpret results correctly.
Temperature Effects on Voltage
Cold cells resist current flow, dropping voltage by 0.05V–0.1V below room-temperature values. Warm cells behave oppositely, reading slightly higher. Always test at a consistent temperature for comparable results.
Cell Age and Cycle Count
Every charge cycle adds internal resistance and trims usable capacity. An aged cell at true 50% capacity may rest at 3.5V instead of 3.7V. Higher internal resistance pulls the reading downward over time.
Manufacturing and Chemistry Variations
- High-voltage variants: Some NMC cells charge to 4.35V, shifting the 50% point upward.
- Blend chemistries: NCA and NMC mixtures produce slightly different curves.
- Cell format: Pouch, cylindrical, and prismatic cells vary a few millivolts.
- Brand differences: Electrode formulation affects the plateau shape.
Practical Impact for Users
Treat any voltage-based 50% estimate as a range, not an exact figure. A 3.6V–3.7V reading on a healthy Li-ion cell is a solid mid-charge indicator. For precise needs, pair voltage with coulomb counting.
Voltage Shifters
- Cold temperatures lower readings by up to 0.1V
- Aged cells rest lower at the same true charge
- Chemistry and brand cause millivolt-level variation
Real-World Applications of 50% Charge Voltage
Knowing the 50% voltage point isn’t just theory—it drives practical decisions daily. From storage to shipping to battery balancing, this mid-point reading guides safe handling. Here’s how it applies in real scenarios.
Long-Term Storage Best Practices
Lithium cells degrade fastest at full charge or deep discharge. Storing them near 50% state of charge minimizes stress and extends lifespan. For Li-ion, that means roughly 3.7V per cell; for LiFePO4, about 3.2V.
Shipping and Air Transport Rules
UN 38.3 regulations require lithium cells shipped at 30% or less state of charge. Verifying voltage before shipping confirms compliance. A Li-ion cell reading near 3.5V typically satisfies this threshold.
Battery Pack Balancing and Diagnostics
- Cell matching: Compare 50% voltages to spot weak cells in a pack.
- BMS calibration: Mid-point readings help reset fuel-gauge algorithms.
- Health checks: Cells drifting from expected 50% voltage signal aging.
- Storage planning: Target 3.7V (Li-ion) or 3.2V (LiFePO4) for long idle periods.
Choosing the Right Target Voltage
Always match your target to the specific chemistry in use. Applying Li-ion values to LiFePO4 cells risks over-discharge or false readings. When in doubt, consult the manufacturer’s voltage chart.
| Application | Target Voltage (Li-ion) |
|---|---|
| Long-term storage | 3.7V |
| Air shipping | ≤3.5V |
| Pack balancing check | 3.6V–3.7V |
Practical Uses
- Store cells near 50% charge for longest life
- Ship at 30% or less per UN 38.3 rules
- Use mid-point voltage to spot weak pack cells
Voltage-to-Capacity Charts for Popular Lithium Cells
Reference charts turn raw voltage into meaningful capacity estimates. Below are approximate state-of-charge values for the most common lithium cells. Use them as guides, not exact measurements.
Li-ion 18650 Voltage vs. Capacity
| Voltage (Rest) | Approx. Charge |
|---|---|
| 4.20V | 100% |
| 3.90V | 75% |
| 3.70V | 50% |
| 3.50V | 25% |
| 3.00V | 0% |
LiFePO4 Voltage vs. Capacity
| Voltage (Rest) | Approx. Charge |
|---|---|
| 3.40V | 100% |
| 3.30V | 75% |
| 3.25V | 50% |
| 3.20V | 25% |
| 2.50V | 0% |
How to Read These Charts Correctly
- Rest voltage only: Charts assume no load and no recent charging.
- Temperature matters: Cold readings run lower than chart values.
- Age reduces accuracy: Older cells may read lower at the same true charge.
- Chemistry first: Never mix Li-ion and LiFePO4 tables.
Quick Reference for Common Cells
An 18650 at 3.70V is roughly half full. A LiFePO4 cell at 3.25V sits near the same point. These two numbers look close but represent very different chemistries—always confirm before drawing conclusions.
Chart Basics
- Li-ion 18650: 3.70V ≈ 50% charge
- LiFePO4: 3.25V ≈ 50% charge
- Charts assume rested, room-temperature cells
Common Questions About Lithium Cell Voltage at Half Charge
Users often hit the same confusing scenarios when checking mid-charge voltage. Here are direct answers to the most frequent questions. Each response targets a specific real-world situation.
Why Does My Cell Show 3.8V at 50% Charge?
Some cells rest higher than the standard 3.7V, especially freshly manufactured or high-voltage variants. A reading of 3.8V may still represent roughly 50% on certain NMC chemistries. Check your cell’s specific datasheet before assuming an error.
Is 3.5V Really 50% on a LiFePO4 Cell?
No—3.5V on LiFePO4 is closer to 90% charge, not 50%. Its flat curve means small voltage changes represent large capacity shifts. LiFePO4 sits near 3.25V for true half charge.
Can I Trust Voltage After Charging?
No, freshly charged cells read artificially high due to surface charge. Wait 1–2 hours for the voltage to settle before judging state of charge. Otherwise you’ll overestimate capacity significantly.
Quick Troubleshooting List
- Reading too high: Cell still settling after charge—wait longer.
- Reading too low: Cold temperature or heavy recent load.
- Inconsistent readings: Aging cell or poor probe contact.
- Unexpected value: Wrong chemistry chart applied.
When to Stop Relying on Voltage
If accuracy matters—like in medical devices or EVs—voltage alone won’t cut it. Switch to coulomb-counting gauges or a smart BMS. Voltage works best for quick, low-stakes checks.
Quick Answers
- 3.8V can still mean 50% on some NMC cells
- 3.5V on LiFePO4 is near full, not half
- Always let cells rest before reading voltage
Conclusion: Reading Lithium Cell Voltage at 50% Charge
A lithium cell at 50% charge shows 3.6V–3.7V for Li-ion and about 3.2V–3.3V for LiFePO4. These mid-point readings guide safe storage, shipping, and pack diagnostics.
Always measure rested, open-circuit voltage at consistent temperatures. Match readings to the correct chemistry chart for reliable results.
Grab your multimeter and test your cells today. Proper voltage checks protect performance and extend battery lifespan.
With the right method, reading half-charge voltage becomes quick and dependable.
Frequently Asked Questions about Lithium Cell Voltage at 50% Charge
What voltage is a lithium-ion cell at 50% charge?
A healthy lithium-ion cell rests at roughly 3.6V to 3.7V at 50% state of charge. This applies to common NMC and NCA chemistries found in 18650 and pouch cells.
Readings vary slightly by brand, age, and temperature. Always measure after resting the cell for one to two hours for an accurate open-circuit value.
Is 3.5V equal to 50% on a lithium battery?
No, 3.5V is typically below 50% for Li-ion cells, closer to 25–30% capacity. For LiFePO4, 3.5V is actually near full charge.
Chemistry determines the meaning of any voltage. Always confirm which lithium type you’re testing before interpreting the reading.
How do I check if my lithium cell is at 50% charge?
Disconnect all loads, let the cell rest 1–2 hours, then measure DC voltage with a multimeter. Compare the reading to a chemistry-specific voltage chart.
For Li-ion, target 3.6V–3.7V. For LiFePO4, target 3.2V–3.3V. Avoid measuring during charging or under load.
Why does my lithium cell show different voltages at the same charge level?
Temperature, cell age, and internal resistance all shift voltage readings. Cold cells read lower, while aged cells rest below fresh values.
Manufacturing differences and chemistry blends add small variations too. Treat voltage-based charge estimates as ranges, not exact figures.
What is the best way to store lithium cells at 50% charge?
Charge or discharge cells to approximately 3.7V (Li-ion) or 3.2V (LiFePO4), then store them in a cool, dry place. Avoid full charge or deep discharge during storage.
Check voltage every few months and top up if it drifts. This practice minimizes degradation and extends overall battery lifespan.
Can I rely on voltage alone to determine state of charge?
Voltage gives a rough estimate but struggles with lithium’s flat discharge curve. Cells at 40% and 60% may read nearly identical voltages.
For precise measurement, use coulomb counting or a smart battery management system. Voltage works best for quick, low-stakes checks.
What voltage should a LiFePO4 cell show at 50% charge?
A LiFePO4 cell typically rests at 3.2V to 3.3V at 50% state of charge. Its flat curve makes voltage-only estimates less reliable than Li-ion.
For accurate readings, combine voltage checks with coulomb counting. This is especially important in solar and RV battery banks.
Why does my cell read 3.8V right after charging?
Freshly charged cells hold surface charge that inflates voltage temporarily. This reading doesn’t reflect true state of charge.
Wait one to two hours for the voltage to settle before measuring. The rested value will be lower and far more accurate.